


Daily Tracking Performance > NEWL00GBR (Newlyn, United Kingdom Of Great Britain And Northern Ireland (the))
EPN station tracking performance:
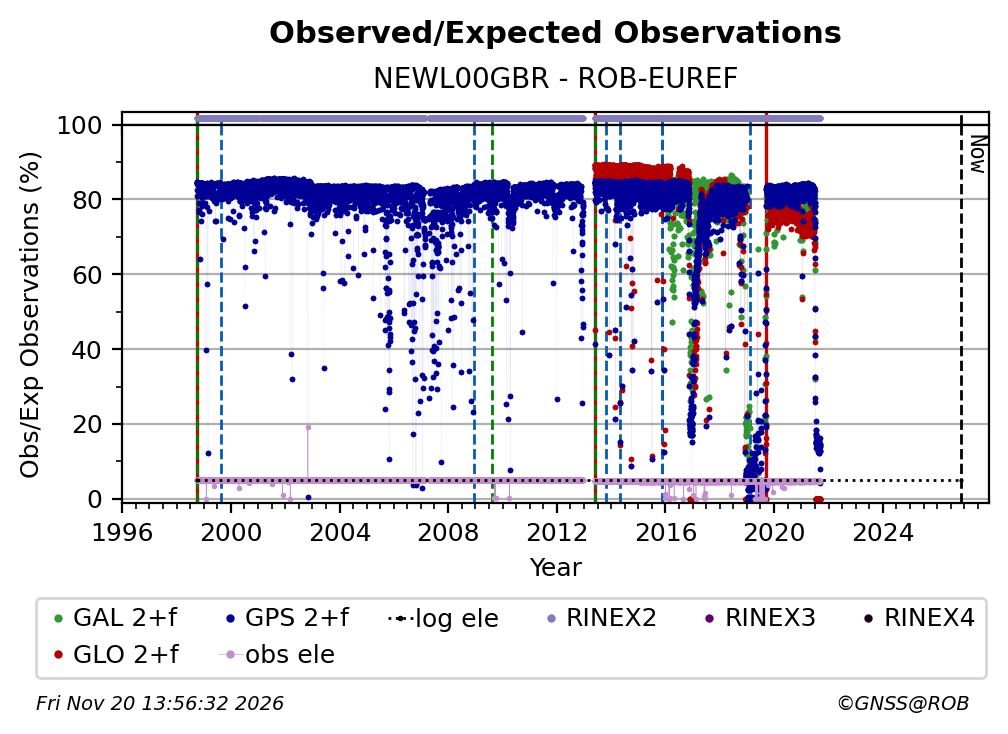
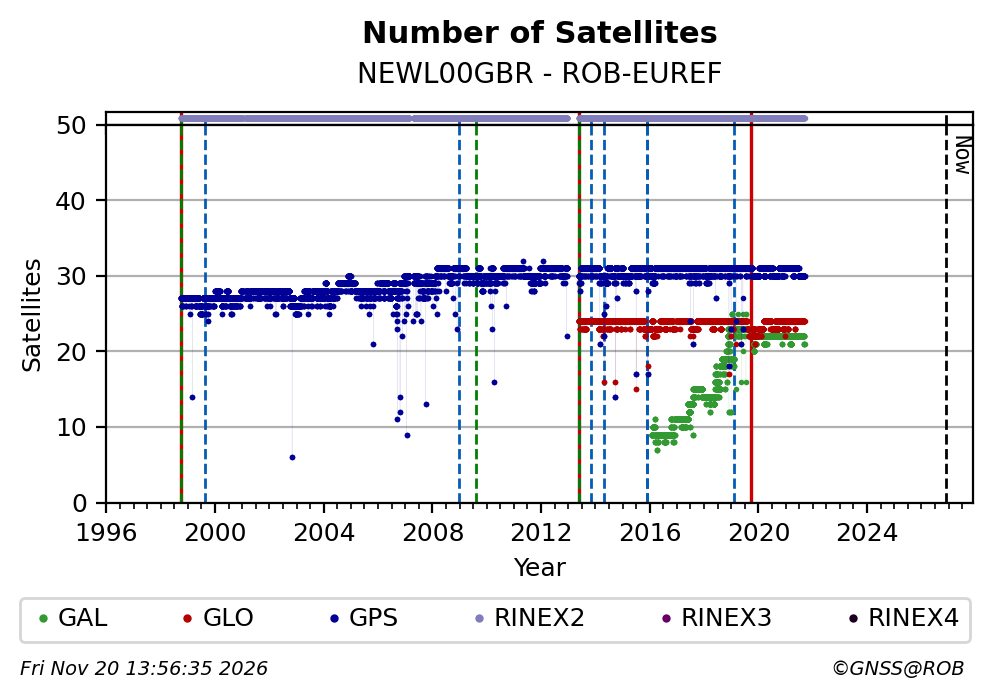
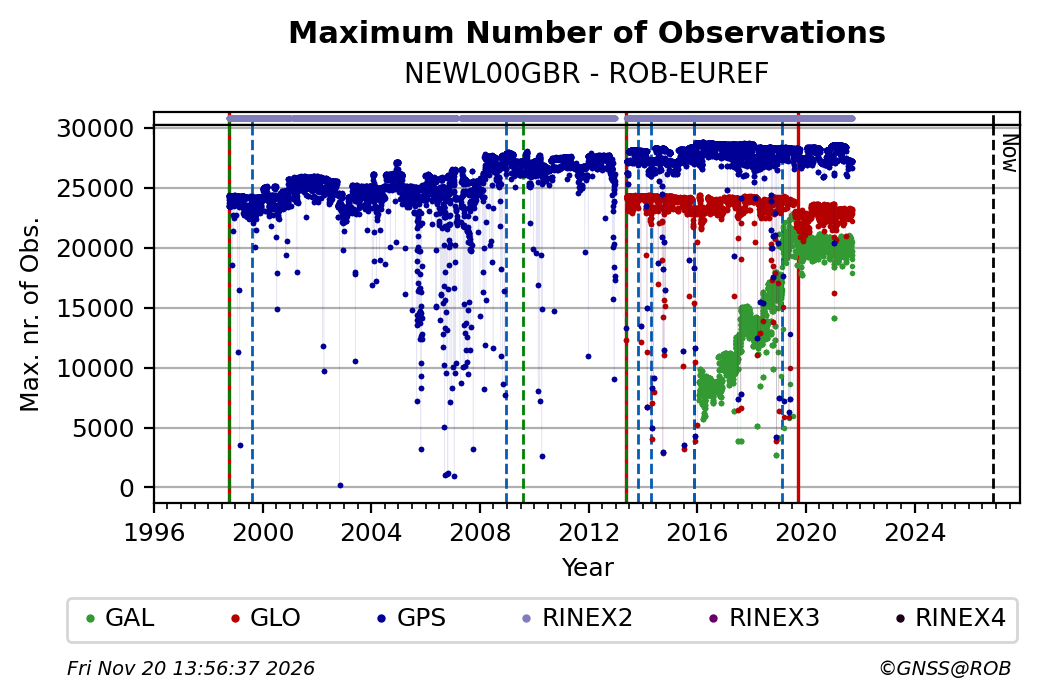
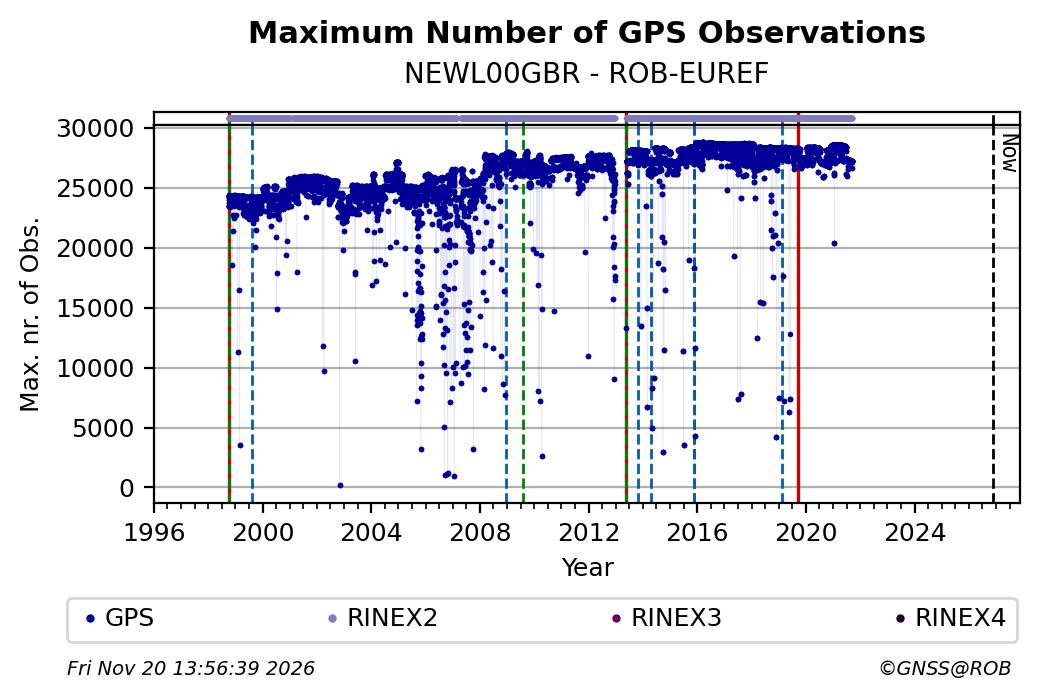
The plots below present the long-term tracking performance of NEWL00GBR. The data quality metrics are computed using the G-Nut/Anubis software, developed by the Geodetic observatory Pecný, Czech Republic. Input files are the daily RINEX 3/4 (when available) and RINEX 2 observation files.
Observed / Expected Observations
Full History


Last 2 years

Number of Missing Epochs
Full History

Last 2 years
Number of Satellites
Full History
Last 2 years
Maximum Number of Observations
Full History
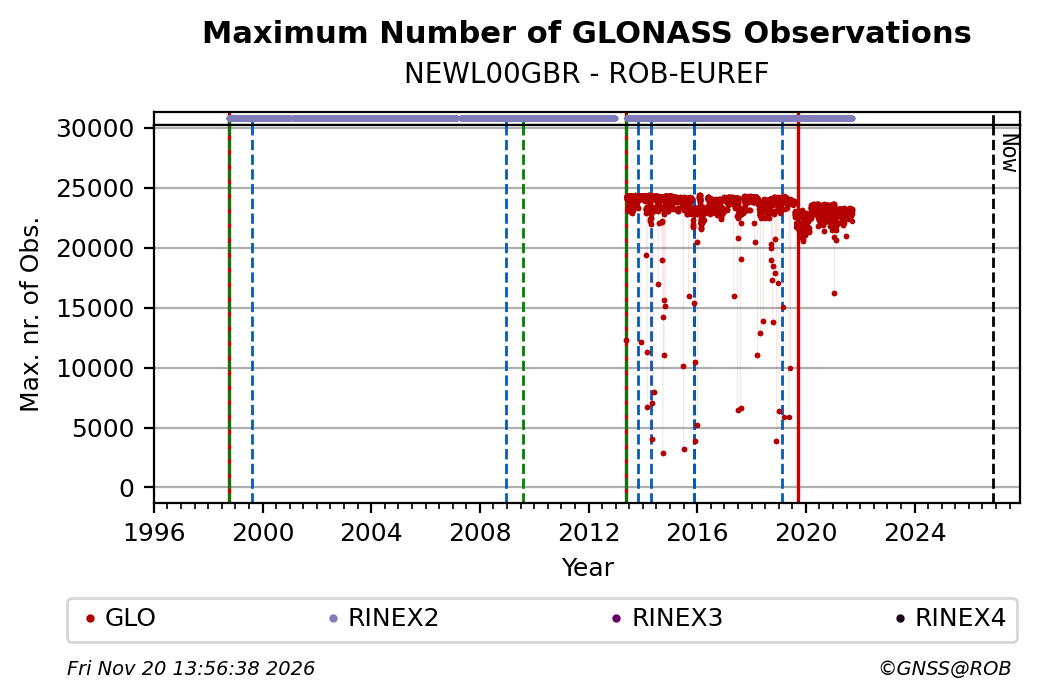
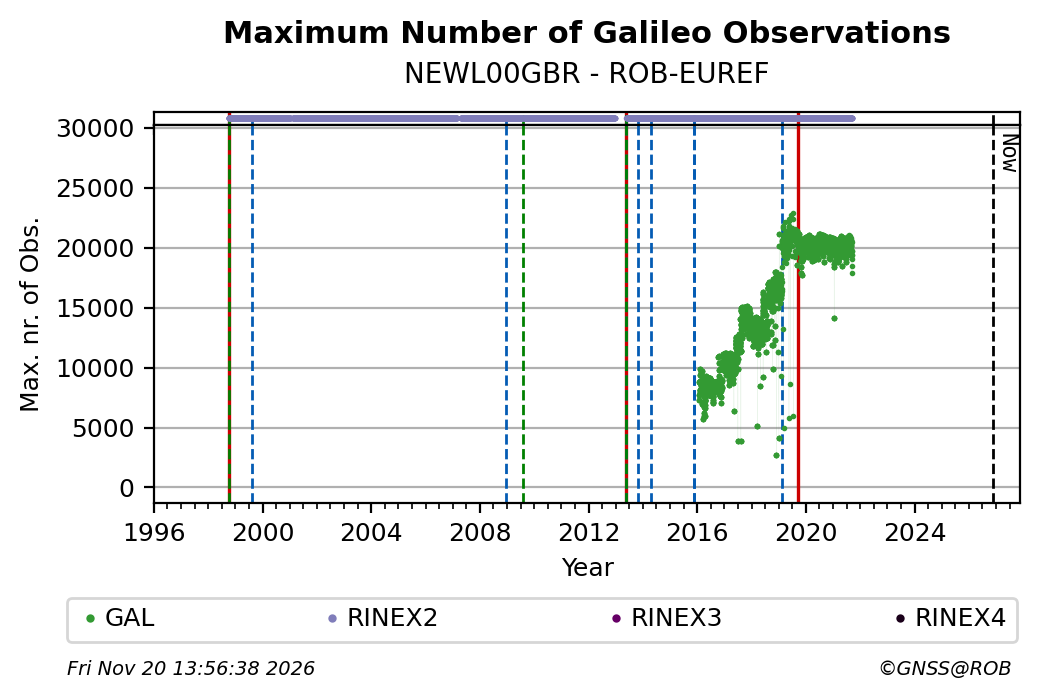
Last 2 years
Number of Cycle Slips
Full History
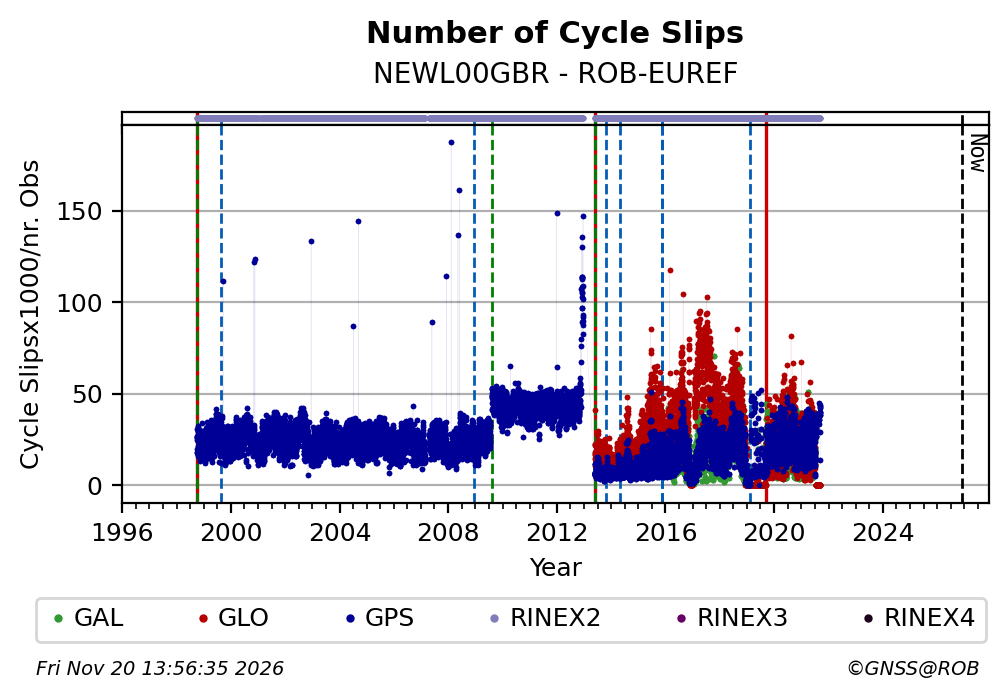
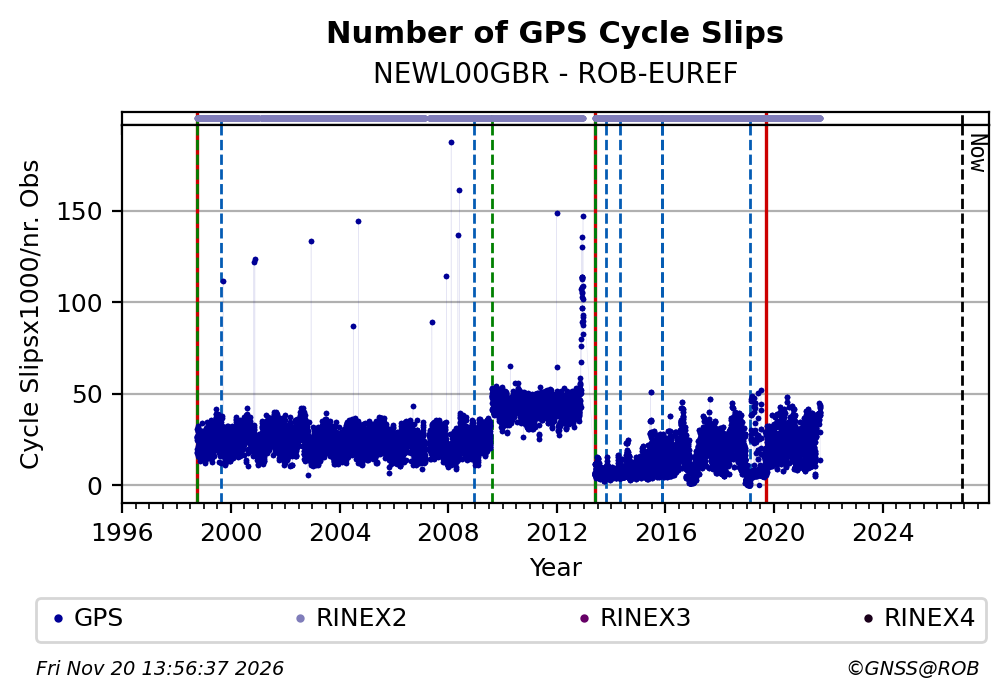

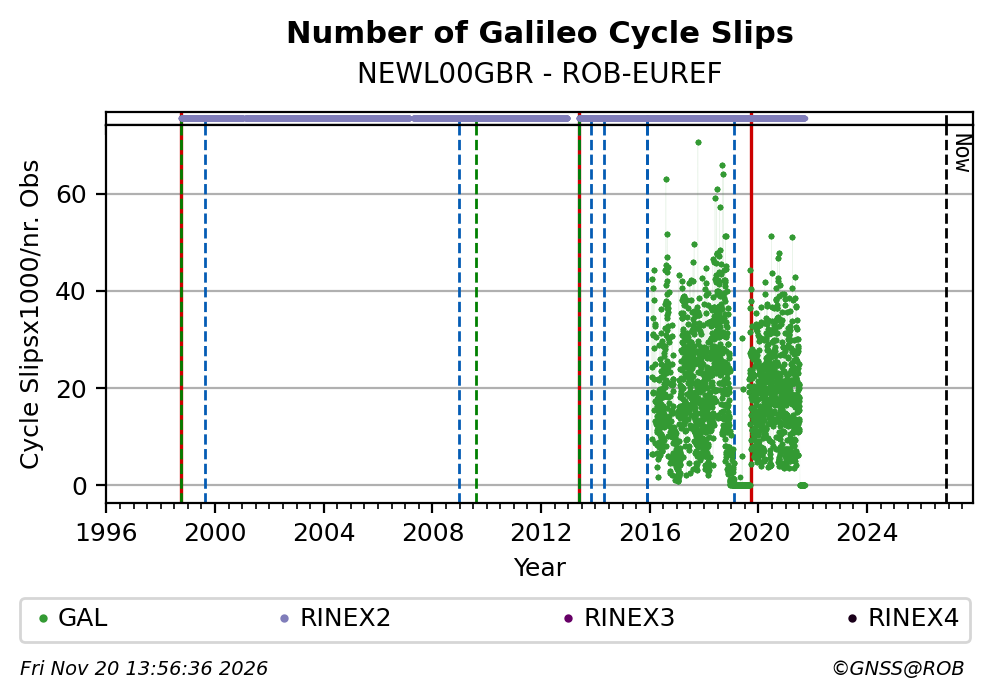
Last 2 years
Multipath Values
Full History
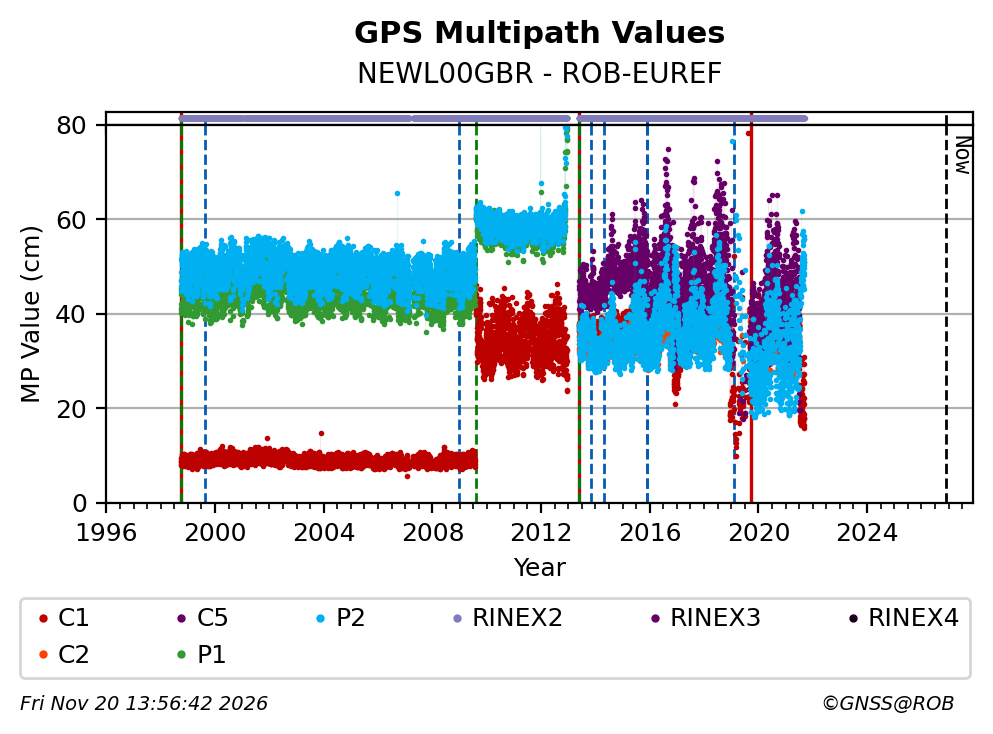
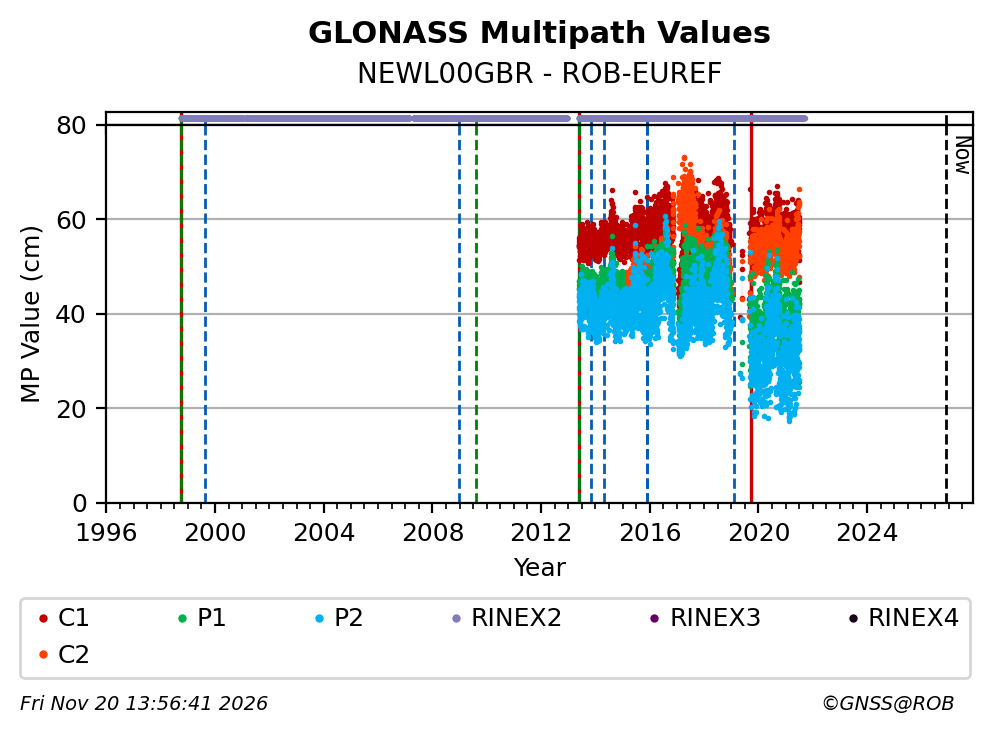
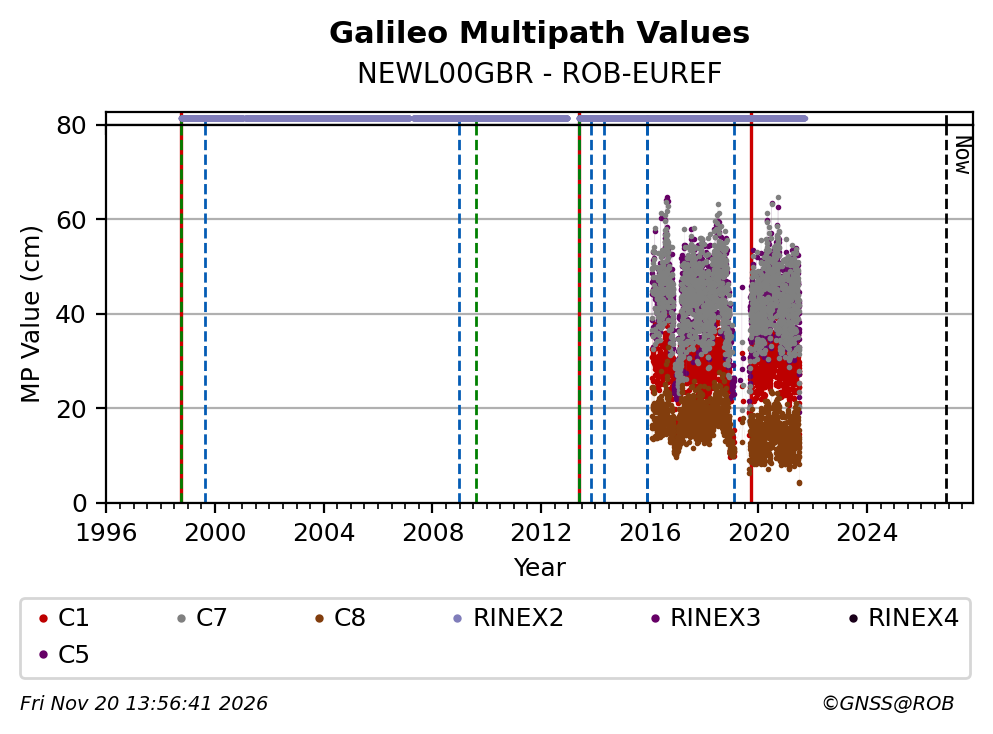
Last 2 years
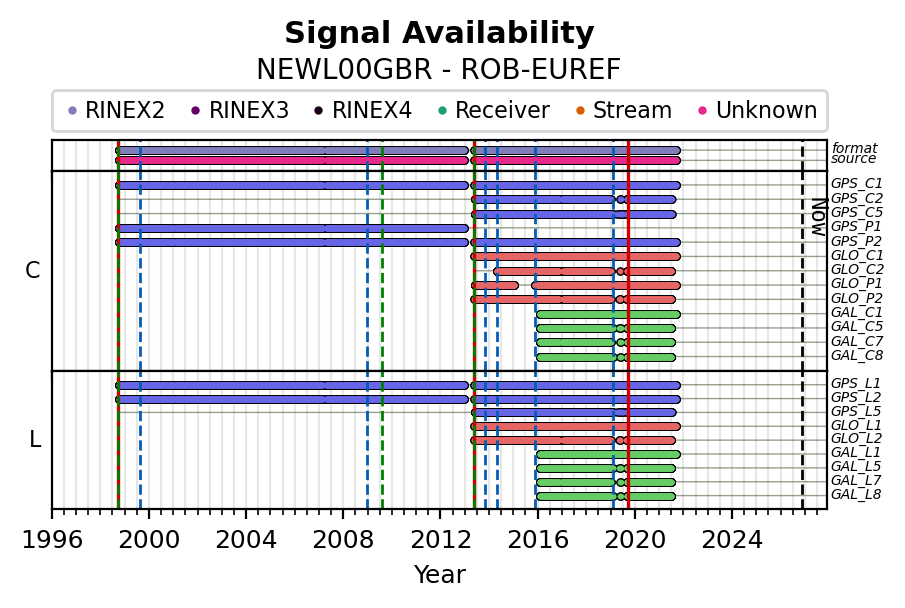
Signal Availability
Full History
Last 2 years