
Monthly Skyplots > NOA100GRC (Athens, Greece)
Skyplots
Select a station:
Select a month:
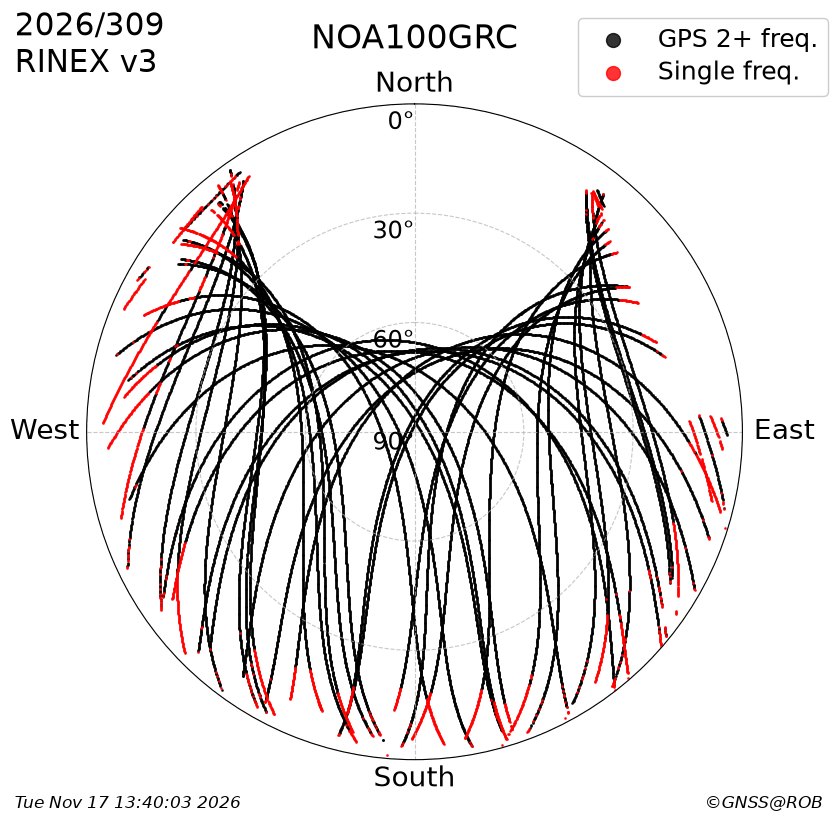
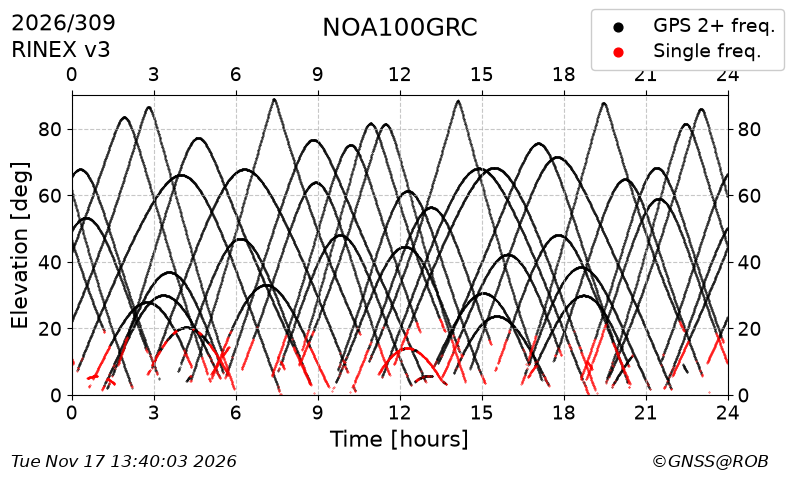
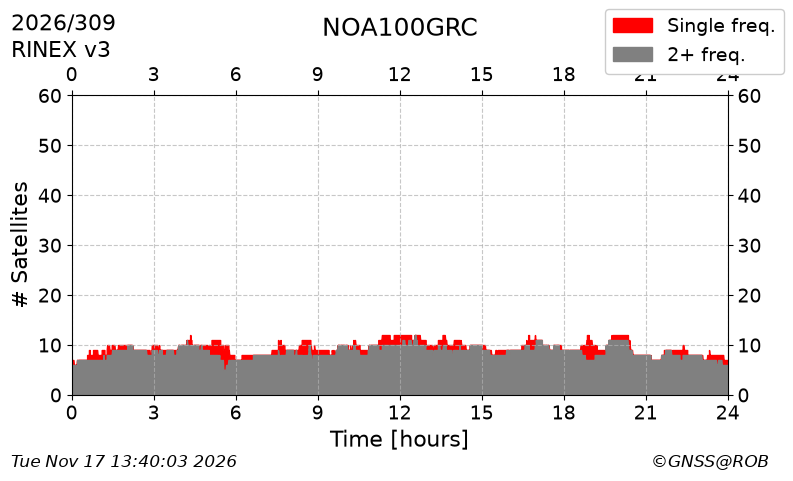
The plots below show a snapshot of the station tracking over one day. They are produced once a month using the daily RINEX 2, RINEX 3, or RINEX 4 observation files. For the RINEX 2 files, only GPS and GLONASS observations are considered. The metrics are computed using the G-Nut/Anubis software, developed by the Geodetic observatory Pecný, Czech Republic.
Data Completeness
Skyplot
Time/Elevation
Time/Number of Satellites
Azimuth/Elevation
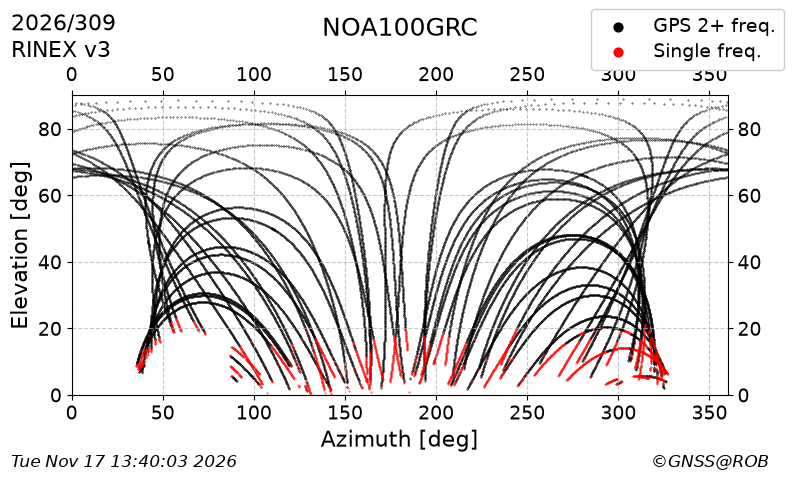
Multipath
GPS — Multipath
GPS — C1C
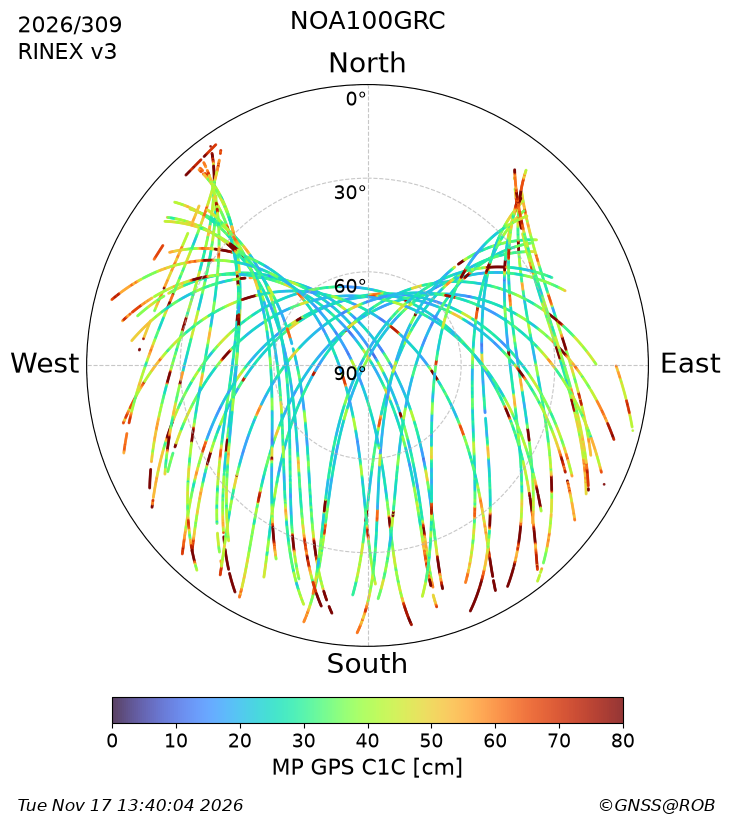
Time / GPS — C1C
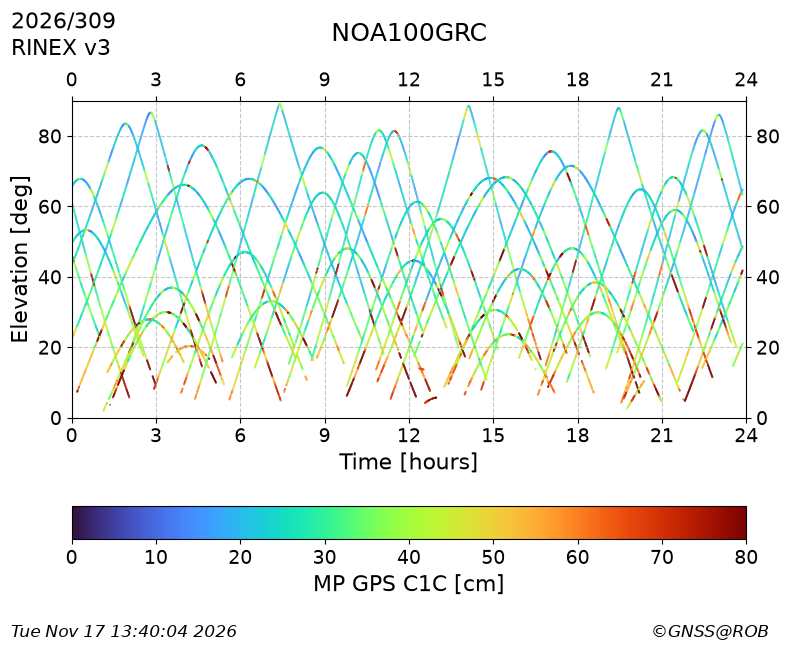
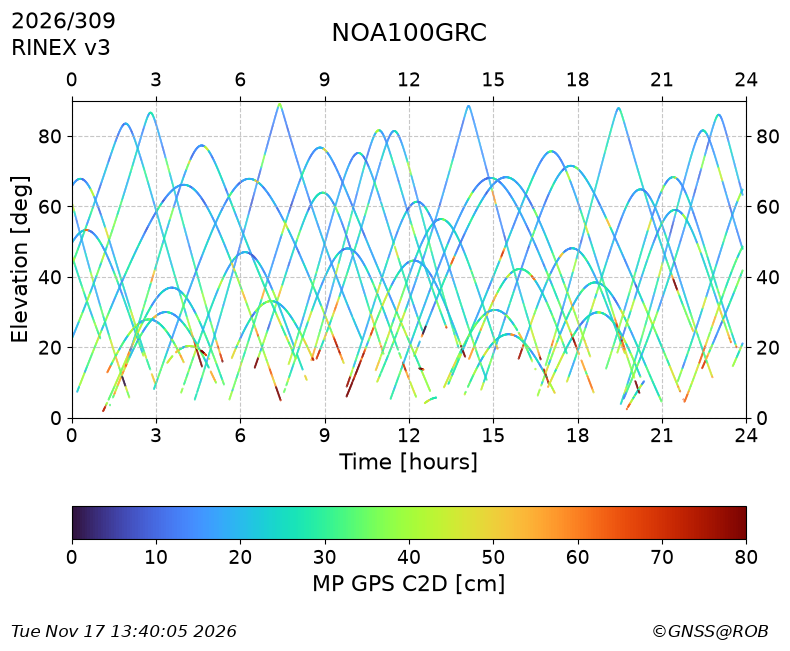
GPS — C2D
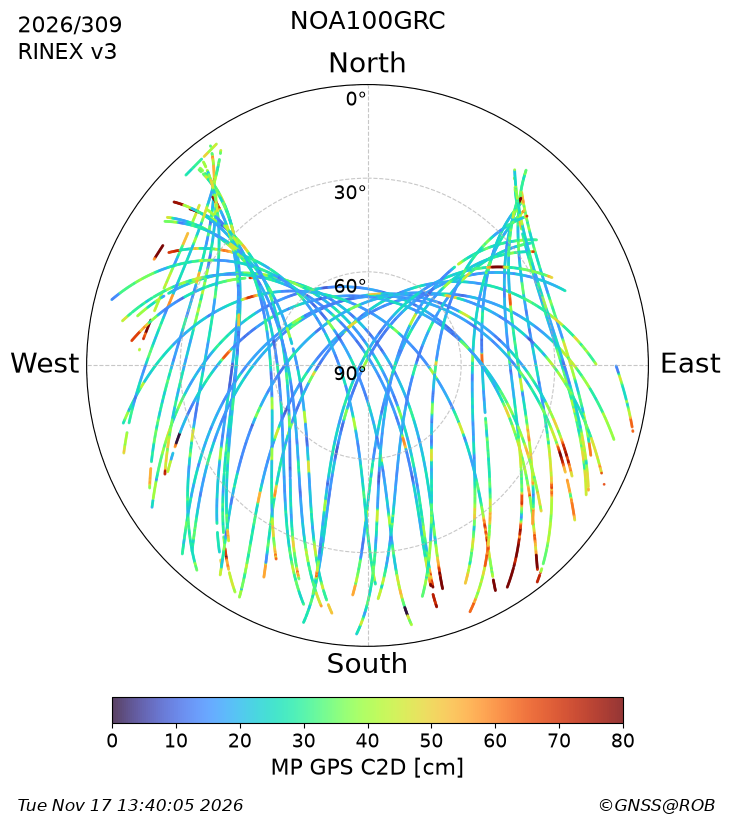
Time / GPS — C2D
Signal-to-noise ratio
GPS — SNR
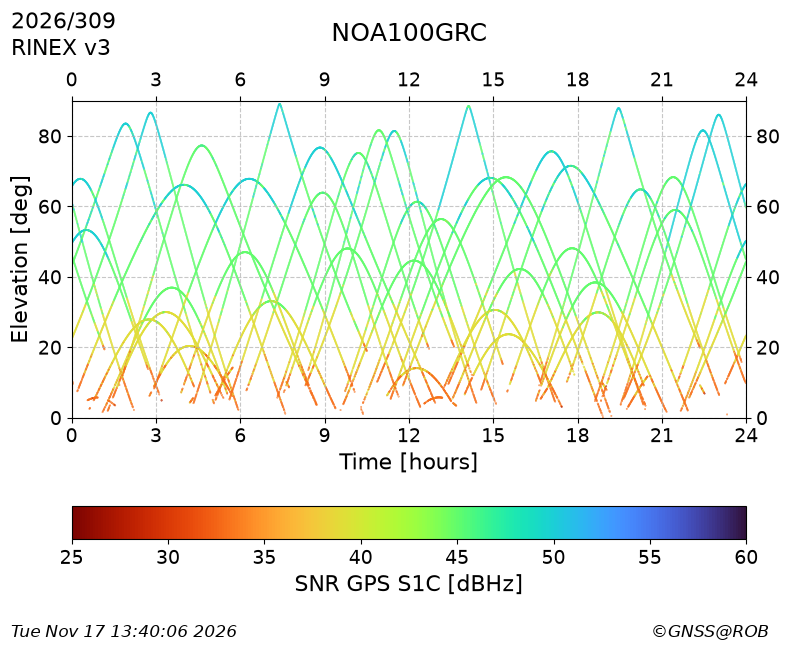
GPS — S1C
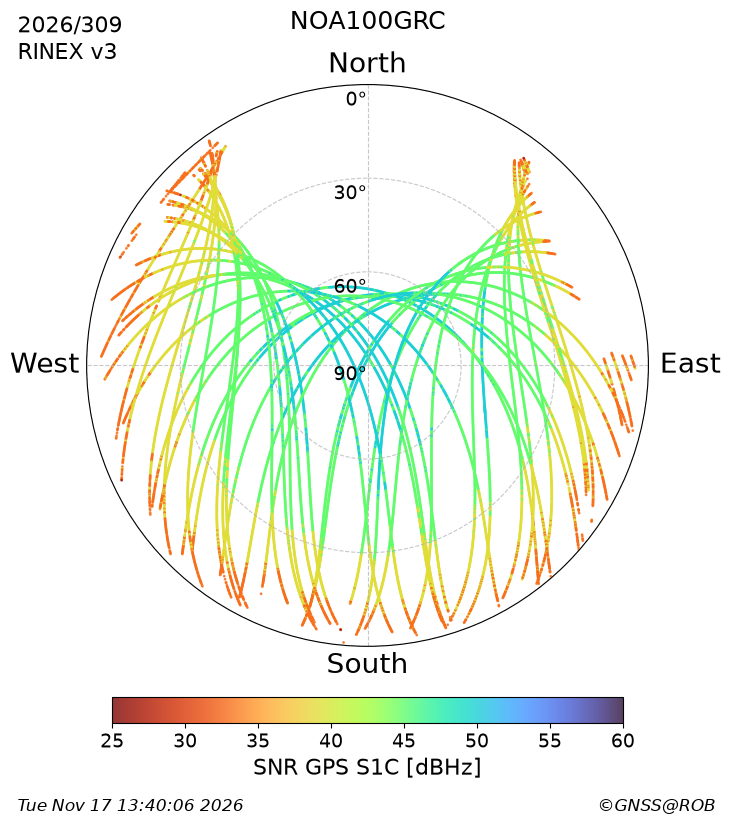
Time / GPS — S1C
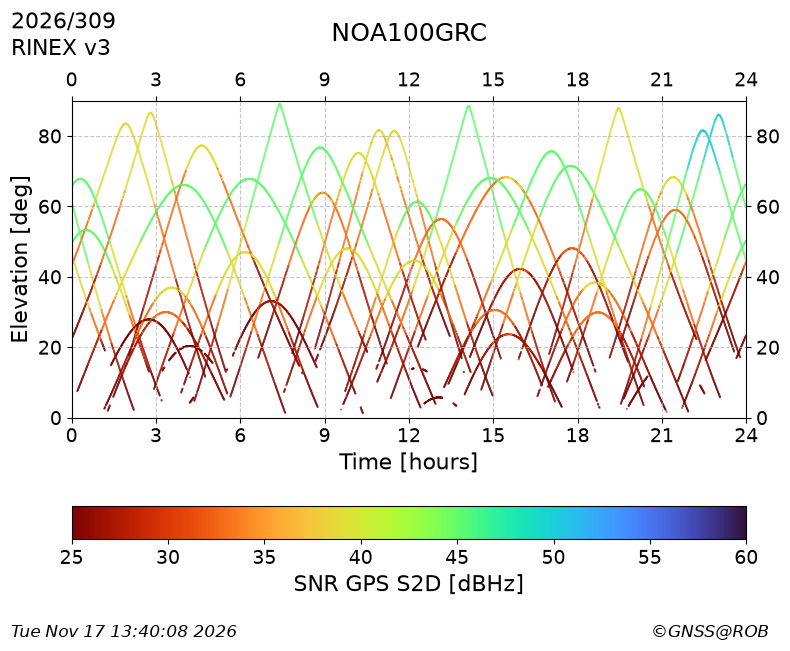
GPS — S2D
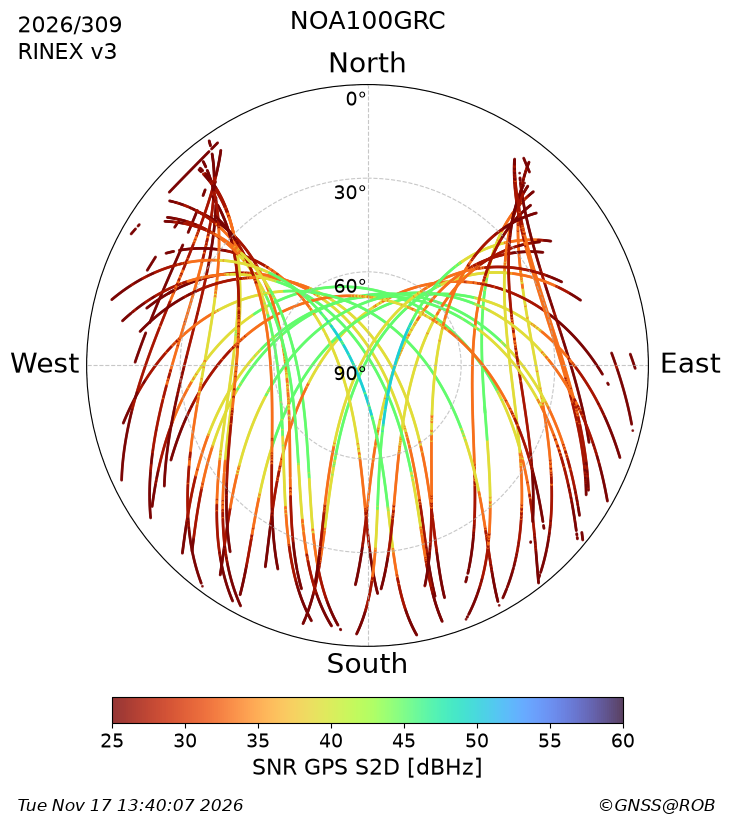
Time / GPS — S2D