EUREF Permanent GNSS Network
ORGANISATION
About
Components
Working Groups & Projects
Management
EUREF Governing Board
EPN Central Bureau
EPN Coordination Group
Contributors
Collaborations
Site Map
NETWORK & DATA
Description & Status
Network Status
Station List
Maps
Tracked Frequencies
Data Quality
Daily
Monthly Snapshots
updated
Station Comparisons
Operational Centres
Data access
Introduction
Daily & Hourly
Introduction & Maps
Data Centres
Data Latency
Real Time
Introduction
Map
NTRIP Broadcasters
Products & Data Streams Status
Latency & Metadata
updated
Highrate
Tools
Site Log Submission (M3G)
Site Log File Check (no submission)
Site Picture Submission (M3G)
Future
Proposed Stations
Propose a new EPN station
PRODUCTS & SERVICES
Analysis Centres
Introduction
Contributing Agencies
Post-processed Products
Daily/Weekly Combined EPN Positions
Introduction
Combination Strategy
pdf
Reference Frame
Tropospheric Delays
EPN-repro1
EPN-repro2
Reference Frame
Products & Services
Official Reference Frame Solution (IGb14)
Description & Download
ETRS89/ITRS Positions & Velocities
Position Time Series
Tool for Reference Station Selection
Temporary Hybrid Solution (IGS20)
Description & Download
new
Hybrid Position Time Series
new
Real-time Products
Satellite Orbit & Clock Correction Streams
Services
ETRF/ITRF Coordinate Transformation
Web services (API)
DOCUMENTATION
Formats
RINEX
Products
Satellite Orbits & clocks
Station Metadata
Guidelines
Equipment & Calibration
Publications
EPN Flyer
pdf
Technical Reports
Journal Articles
Papers (archives)
Newsletter
pdf
new
FAQ
NEWS, EVENTS & LINKS
News
EPN Central Bureau & EUREF Governing Board
Mailing lists
EUREF Mail
LAC Mail
EUREF-IP Mail
Web Site History
Events
Meetings Calendar
AC Workshops
Links
File Server
External Links
Search
Home
Products & Services
Positions & Velocities
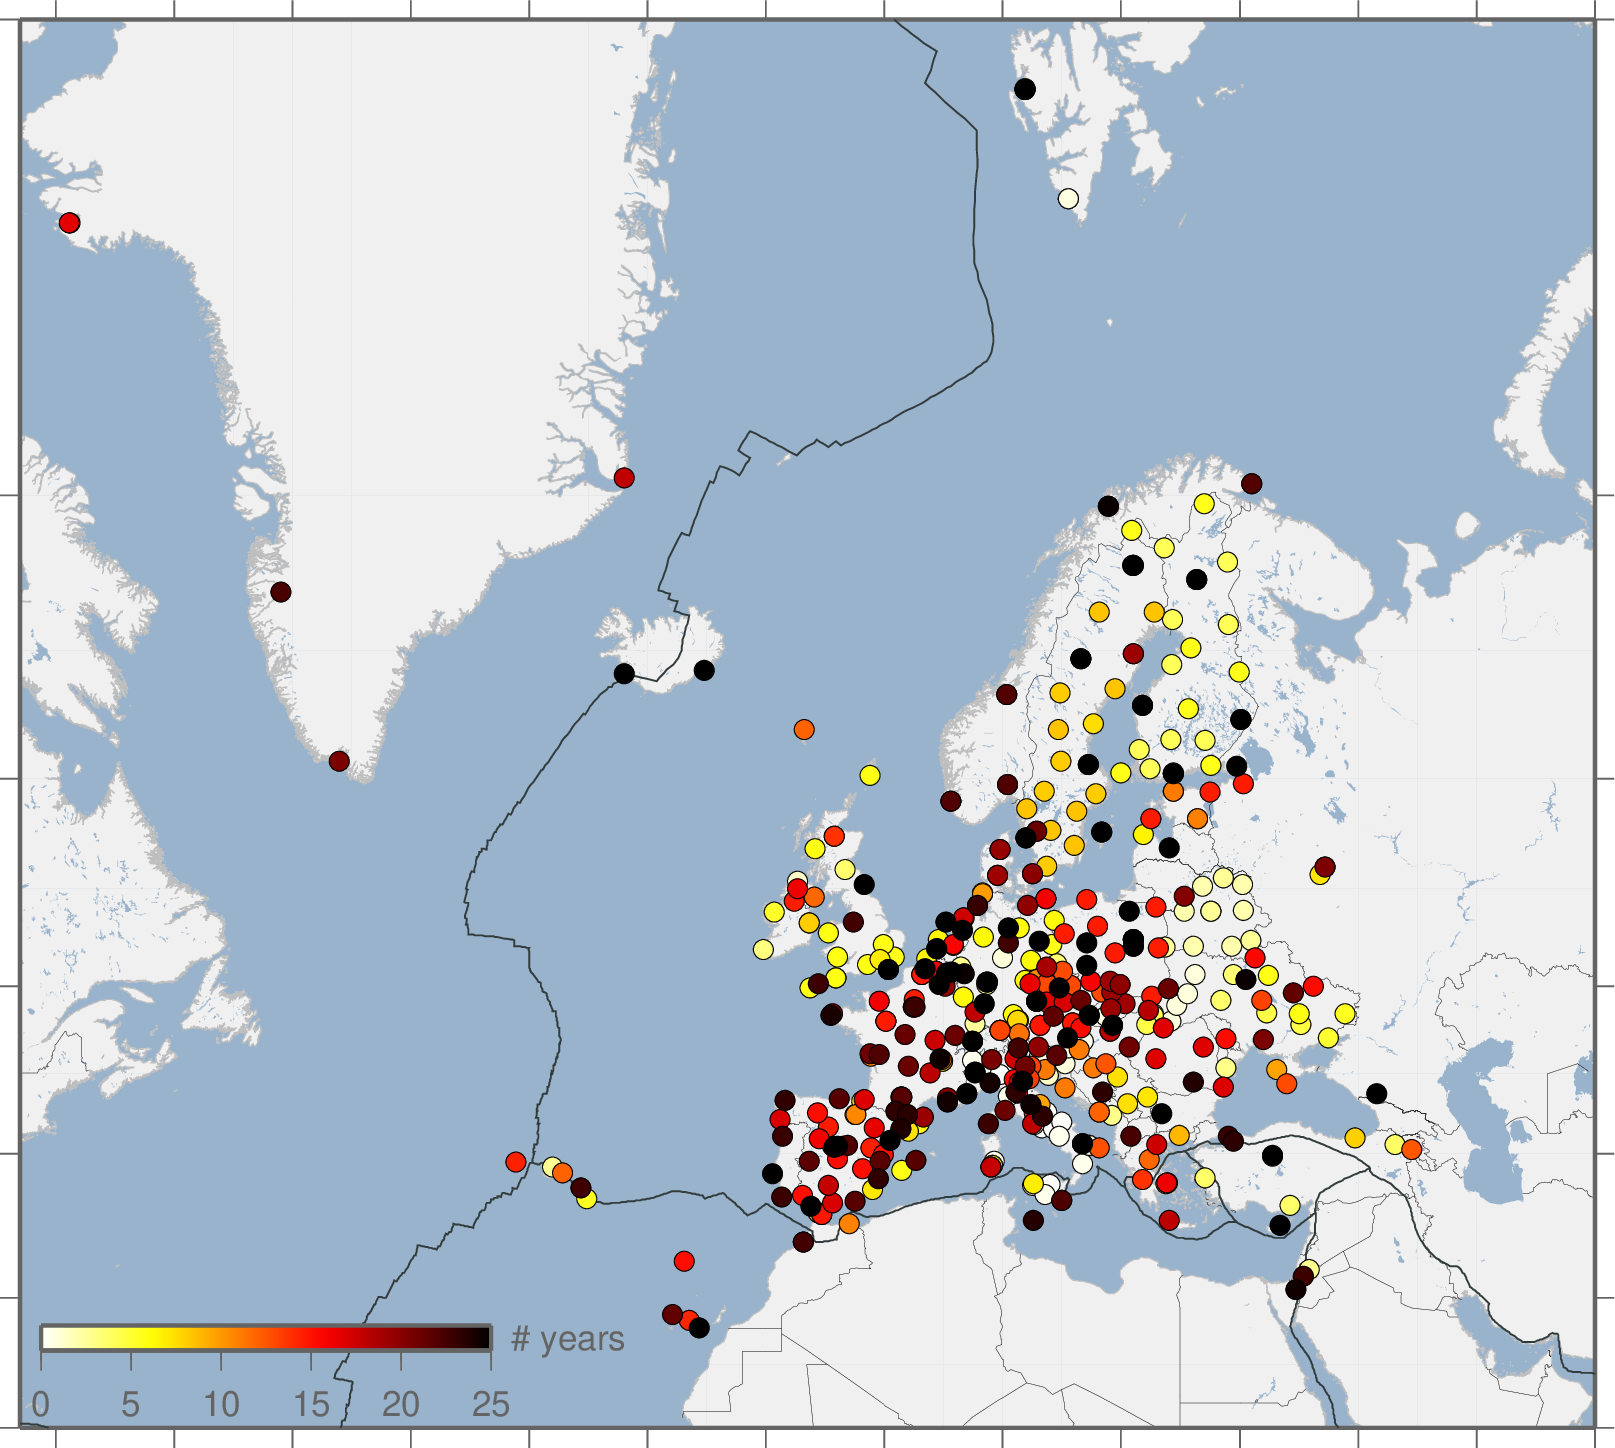
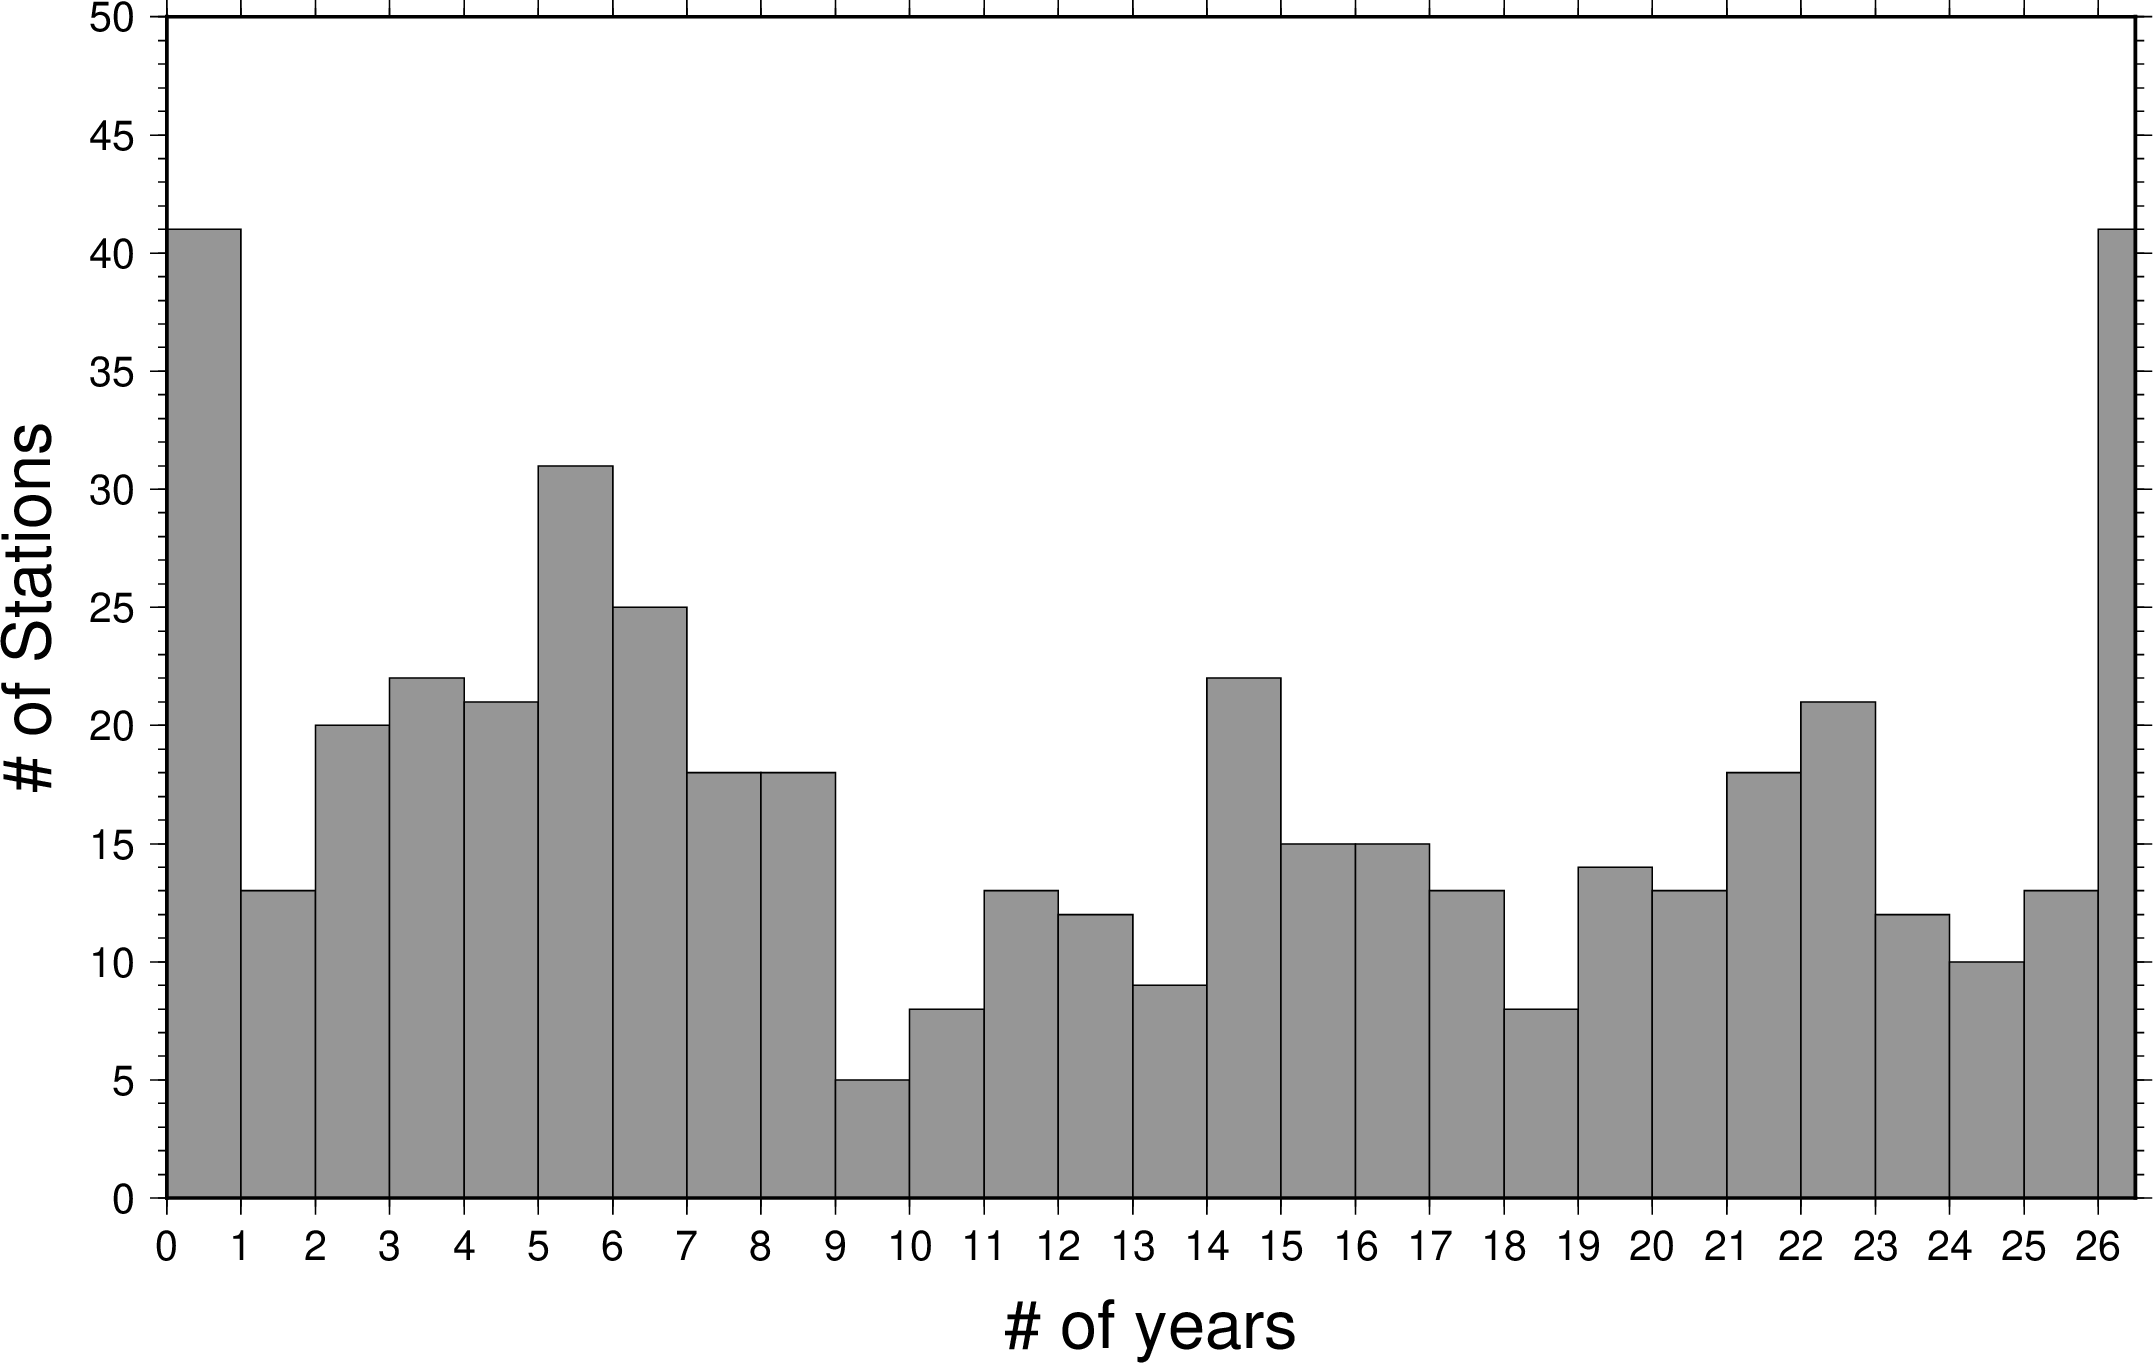
Station Data Length
Station Data Length
4
×
Report error or comment
Useful web page ?
Yes
No
Comment
Email (optional - if you want an answer)
Security
On the left: the map shows the number of years of observations for each EPN stations.
On the right: the plot shows the histogram of the number of observing years within the EPN.